雅思Task1小作文柱状图范文:企业垃圾
2023-05-17 15:23:10 来源:中国教育在线
中国教育在线小编为大家收集整理了雅思Task1小作文柱状图范文:企业垃圾,那么接下来就跟着中国教育在线小编一起来看看,相信你通过以下的文章内容就会有更深入的了解。
雅思Task1小作文柱状图范文:企业垃圾
话题
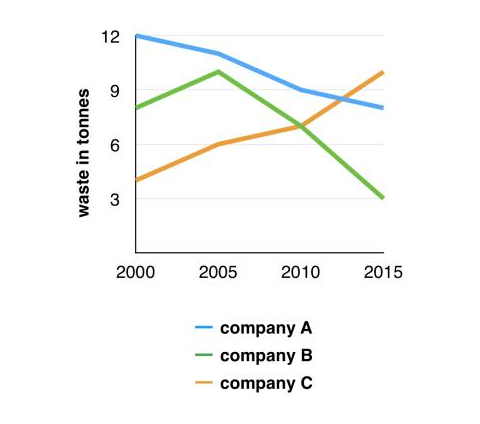
The graph below shows the amounts of waste produced by three companies over a period of 15 years.

范文
The line graph compares three companies in terms of their waste output between the years 2000 and 2015.
It is clear that there were significant changes in the amounts of waste produced by all three companies shown on the graph.While companies A and B saw waste output fall over the 15-year period,the amount of waste produced by company C increased considerably.
In 2000,company A produced 12 tonnes of waste,while companies B and C produced around 8 tonnes and 4 tonnes of waste material respectively.Over the following 5 years,the waste output of companies B and C rose by around 2 tonnes,but the figure for company A fell by approximately 1 tonne.
From 2005 to 2015,company A cut waste production by roughly 3 tonnes,and company B reduced its waste by around 7 tonnes.By contrast,company C saw an increase in waste production of approximately 4 tonnes over the same 10-year period.By 2015,company C’s waste output had risen to 10 tonnes,while the respective amounts of waste from companies A and B had dropped to 8 tonnes and only 3 tonnes.
以上就是“雅思Task1小作文柱状图范文:企业垃圾”的详细介绍,如果还有其他相关问题需要了解,欢迎各位小伙伴热情咨询咱们中国教育在线的老师,预祝各位同学早日取得好成绩!
>> 雅思 托福 免费课程学习,AI量身规划让英语学习不再困难<<


